08 / Campaigns · Content + Social
Same Spotlight. A lot more participation.
One student. One teacher. One staff member. Three Spotlight videos every month.
Communications picked those three people from nominations that were already coming in internally. My director produced the videos, and they often spent more time on someone’s role than on who they were. Once a video was published, people could react. They did not have a real part in who got featured.
In August 2025 I helped redesign the experience. I wanted families and staff to meet the nominees before those videos went up.
August 2025
Before, and after.
Before
- Communications selected one student, one teacher, and one staff member from existing internal nominations.
- My director produced three traditional recognition videos each month.
- The community could react once the videos were published, but had no meaningful role in choosing the features.
After
- A public Spotlight nomination form gave the community a way to submit nominations.
- Submissions went through internal review before nominees were shared publicly.
- I designed Get to Know You graphics featuring the nominees’ personalities and fun facts.
- Families, students, and staff could engage with the nominee posts.
- Schools helped promote participation through ParentSquare.
- We continued publishing three monthly recognition videos, with more personality-focused storytelling.
Nominations
250 nomination form responses.
The public nomination form had 250 responses when it was reviewed. That number is responses, not 250 nominees and not 250 people featured. A response is not necessarily unique, and it was not automatically eligible.
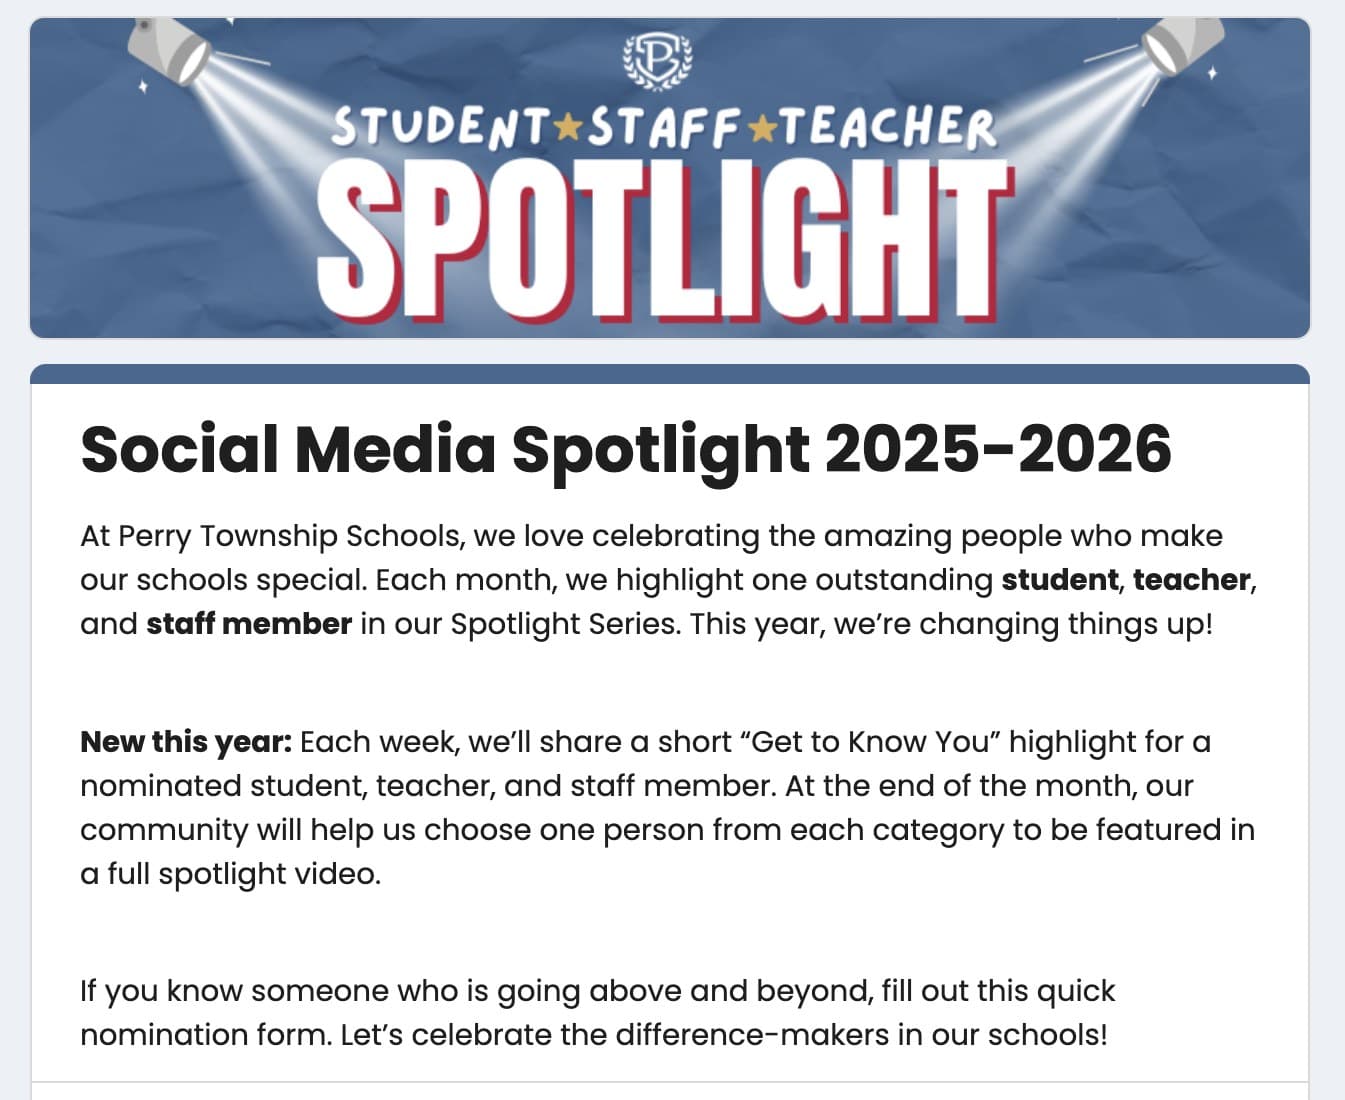
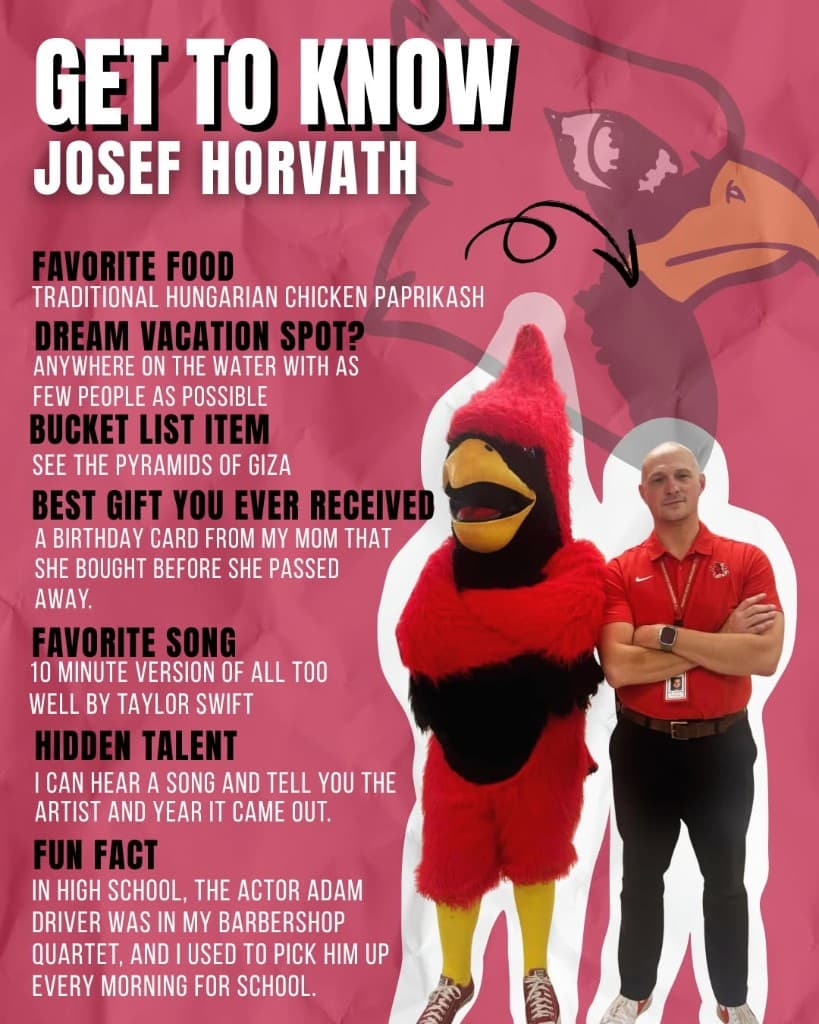
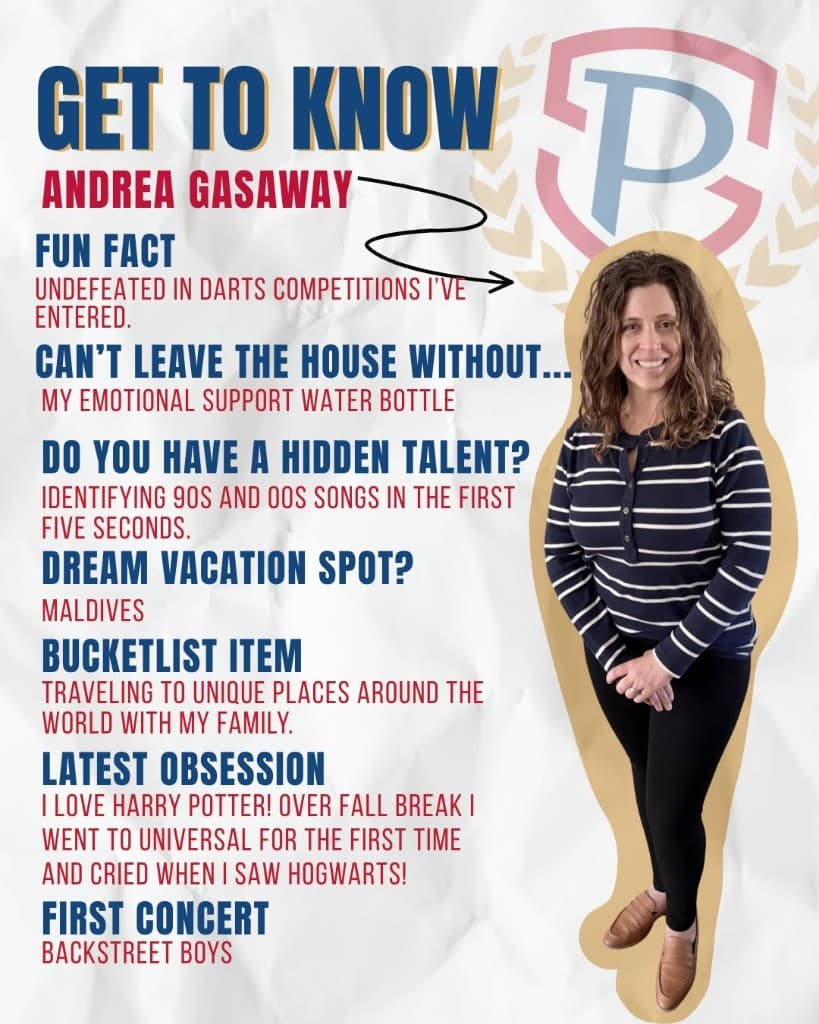
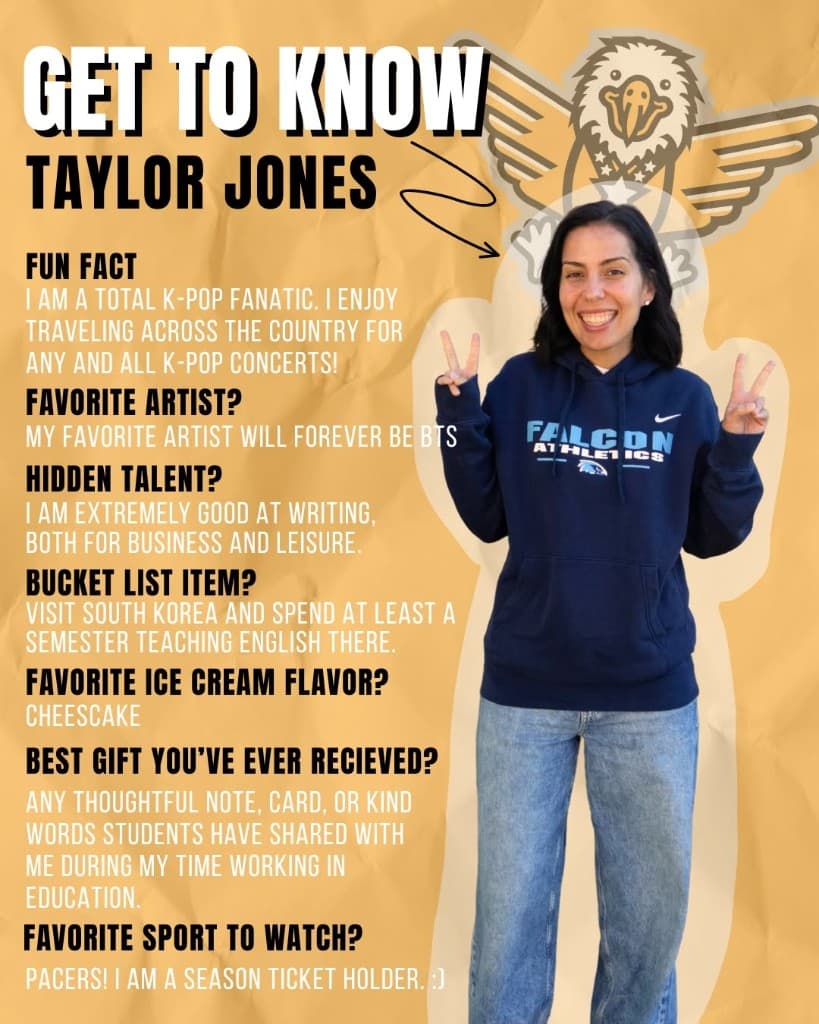
I made the Get to Know You graphics so a nominee showed up as a person, with a few fun facts, instead of only a role or a list of achievements.
Before anything was public
There's a lot more to this than picking a winner.
The form had 250 responses, which meant someone had to go through them.
Before a nominee was introduced publicly, we reviewed the submission and worked through the appropriate internal checks. Featuring students and employees on district platforms comes with responsibilities. We coordinated with the relevant district staff so the people we highlighted were appropriate for public recognition.
A lot of that happened before anyone saw a Facebook post. Once a nominee was cleared to move forward, I created their Get to Know You graphic and helped bring the community into the process.
The social sample
Nomination posts carried most of it.
69.3%of the updated sample’s engagement came from nomination and participation posts
Those posts were one of the biggest additions to the redesigned program. 14,568 of the 21,017 recorded engagements came from them.
The earlier sample, September 2024–March 2025, had 5,656 recorded engagements. The updated sample had 21,017, about 3.7× across the available posts. The newer program included more posts, so that multiple is not a measure of engagement efficiency, and it does not prove the redesign caused the change.
Average recorded engagement per video with available data went from about 298 to about 387. Engagement per 1,000 impressions stayed nearly the same: 81.7 and 82.3.
About this sample
These figures come from Meta Professional Dashboard screenshots I transcribed by hand. They are the posts visible in that sample, not a complete export of every Spotlight post.
Each overlapping screenshot row was counted once. Unrelated posts marked in the older screenshots were left out.
A missing engagement was not treated as zero. The February 2025 student Spotlight video has no visible engagement figure. One September 2025 video entry also has no reported engagement and may be the same video distributed again.
November 2024 includes two entries labeled as teachers. The exact publishing categories there may still need another look.
The two windows are the same seven school-year months. The number and type of posts changed, so the totals are not a per-post test.
This is an observation of the sample. It is not a controlled experiment, and it does not isolate one cause.
Old and new view counts are not compared. Meta changed how views were reported between these periods.
Engagements per 1,000 impressions use the comparable records in the review: 81.7 before, 82.3 after.
What I took away
From a form to a monthly feature.
The 250 form responses and the 3.7× social sample answer different questions. One shows people were willing to submit nominations. The other shows how the expanded posts performed.
The graphics and the review sit between those two. That is the campaign, from a name on a form to a monthly feature. My director still produced the recognition videos, and final selections still went through internal review. We still publish three videos a month.